

A slow website can be caused by oversized images, heavy scripts, unsuitable caching, plugins, database work or server response times. It does not automatically mean you need new hosting or a complete rebuild. First establish whether the problem affects every page, a particular page or an interaction such as checkout.
For a business in Malaysia, the aim is practical: customers should be able to read information, use buttons, send enquiries and buy without unnecessary delays. Use this guide to gather evidence before requesting repairs, rather than changing technical settings at random.
Check the symptoms before choosing a fix
| Symptom | What to check |
|---|---|
| Nothing appears for a long time | Server response, redirects and page generation |
| Text appears but the main image arrives late | Image size, download priority and loading behaviour |
| The page opens but buttons respond slowly | JavaScript, widgets and browser work |
| Content moves while being read | Image space, fonts, banners and content inserted later |
| Only the cart or checkout is slow | User sessions, payment integrations and e-commerce functions |
| Only one device or network is affected | The connection, device and browser conditions |
Compare the homepage, a service page and the affected page. Try mobile and desktop, Wi-Fi and mobile data, and a logged-out session. Record the URL, time and action being performed. These checks narrow the investigation but do not prove a cause on their own.
12 causes of a slow website worth checking
1. Images are too large for their display area
Original camera images may be much larger than the website needs. Check both dimensions and file size, then use responsive sizes and compression that keeps useful detail. WebP can help, but conversion alone does not fix excessive dimensions. Some logos and graphics may need a different format.
2. The main image loads too late
A banner can arrive late even at a moderate file size if the browser discovers it late or it is lazy-loaded. Do not apply lazy loading to every image without distinguishing immediately visible content from images further down the page. A developer should identify the actual LCP element.
3. Heavy video, sliders and animation
Autoplay video, multiple slides and movement effects add downloads and browser work. Consider a poster image, a video that starts after a click or one clear banner. Decide whether each element helps customers understand the service or simply fills space.
4. CSS and JavaScript delay rendering
Some files must be processed before content can appear. Removing unused code or changing loading behaviour may help, but defer, delay and minify settings can break menus, forms or checkout. Test risky changes on staging before enabling every option on the live website.
5. Third-party widgets and scripts
Live chat, maps, embedded videos, pixels and marketing tools use additional resources. Check whether every tool is needed on every page. Some can load when used, subject to functional and tracking requirements. Discuss changes with the marketing team before removing important tracking.
6. Plugins or the theme do too much work
Plugin count alone is not a performance measure. One plugin making external requests or expensive database queries can have a large effect. Record recent changes, check logs and test conflicts in a controlled environment. Do not randomly disable security, form or payment plugins in production.
7. Caching is missing, ineffective or overlapping
Caching reduces repeated work, but results depend on page type and configuration. Carts, checkout and private content must not be treated like ordinary information pages. Multiple cache plugins are not automatically better. Check real functions as well as speed after changes.
8. The server takes too long to respond
Initial response time can increase because of resource limits, traffic, code or database work. Ask the hosting provider or developer to check resource use and logs when the problem occurs. Upgrade hosting when evidence points to capacity or configuration as a constraint. Start with the guide to hosting and domains.
9. Database work and background tasks are heavy
Slow queries, excess records and overlapping scheduled tasks can increase load. Product imports or backups may coincide with slower periods. Do not clean a database without a restorable backup: order records, customer information and settings need protection.
10. Too many fonts or an unnecessarily complex layout
Multiple font families, weights and deeply nested elements add loading and rendering work. Keep the variations you need and simplify the layout without harming readability. This is also part of building a useful, user-friendly website.
11. Redirect chains and inefficient asset delivery
Redirect chains and links to old files add steps before content arrives. Check them after a migration, domain change or HTTPS switch. A CDN may help asset delivery but cannot replace fixes to slow code or server work. Understand the impact on the website and email before changing DNS.
12. Unusual traffic, bots or security problems
A surge in requests or suspicious processes can overload a site. Slowness alone does not prove a hack; check logs and other signs such as unexpected redirects or changed files. Prioritise security investigation when there are signs of a threat. Do not turn off protections to chase a higher test score.
A practical first step: reduce image sizes safely
Start with a few images on the slow page, not the entire Media Library. Keep the originals and record file sizes before and after export. If an image appears on several pages, check those uses before replacing it.
- Identify the purpose: a wide banner, product image or thumbnail. Choose dimensions for the actual display area instead of automatically uploading the full camera resolution.
- Open the alfatihstudio Image Compressor & Resizer, add a copy and set suitable dimensions. Try a WebP export and compare the actual file size.
- Check labels, textures and edges on a phone and a larger screen. Increase quality if text becomes blurry. Below 200 KB can be a working target for ordinary catalogue images, but is not a universal requirement.
- Upload the optimised copy and replace the image on one page first. Keep accurate alt text. Renaming the extension does not convert the file format.
- Test the same URL again under comparable conditions. Check image placement, menus and forms too. If there is little improvement, scripts, caching or server response may be involved.
For dimensions, transparency and export checks, read the guide to preparing product images for websites. Image optimisation does not guarantee a PageSpeed score of 100.
Do not delay the main image that is visible as soon as the page opens simply to reduce initial downloads. Images further down may be lazy-loaded where appropriate. Ask a developer to identify the LCP image first. See Google’s image lazy-loading guidance.
Read PageSpeed results in context
PageSpeed Insights provides real-user experience data when enough is available and a Lighthouse lab test. They serve different purposes. A single test score can vary; record repeated tests of the same URL under comparable conditions. See the official PageSpeed Insights explanation.
Google’s Core Web Vitals guidance defines good targets as LCP at or below 2.5 seconds, INP at or below 200 milliseconds and CLS at or below 0.1, assessed at the 75th percentile of user experiences. LCP concerns main-content loading, INP interaction responsiveness and CLS layout stability. Field INP is not the same as a Performance score or lab TBT.
Missing field data does not mean the website has passed or failed. Use lab results to guide investigation, then test real use. A fast website with a broken enquiry form still fails to help customers.
An example performance report
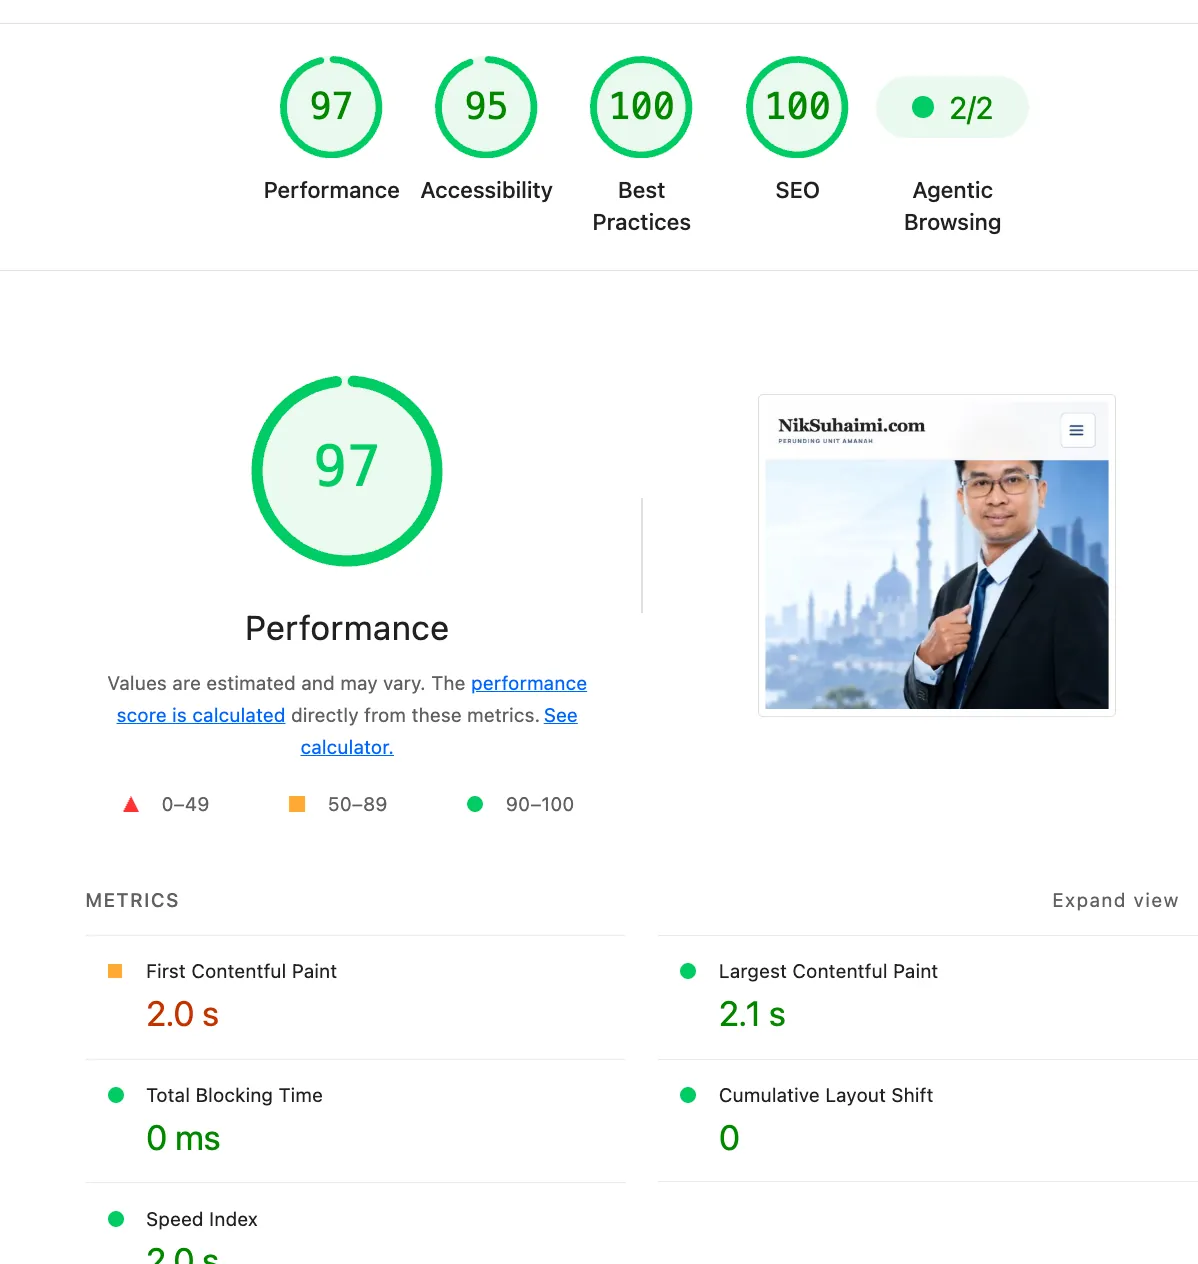
The supplied NikSuhaimi.com screenshot, added to the original article on 6 October 2026, shows Performance 97, LCP 2.1 seconds, Total Blocking Time (TBT) 0 milliseconds and CLS 0 in that test. It is an example of how to read a report, not a fresh test on 2 November 2026 or a promise of permanent scores. TBT is not INP, and the screenshot alone does not establish a real-user Core Web Vitals pass.
A safer order for repairs
- Record symptoms and initial results before changing anything.
- Ensure a backup and recovery method are available. See the WordPress backup frequency guide.
- Identify the largest likely cause and avoid changing several things at once.
- Test risky changes on staging and prepare a rollback.
- Check relevant menus, forms, login, search, cart and checkout.
- Compare results after changes and monitor user reports.
The official WordPress optimisation guide also covers hosting, caching and performance factors. Choose a configuration for your website rather than copying another site blindly.
When should you ask for help?
Request an inspection when slowness affects enquiries or purchases, starts after an update, returns despite image optimisation, or requires server and database changes. Provide the URL, affected pages, starting time, recent changes and test reports. Do not put passwords in public messages or screenshots.
alfatihstudio’s Website Repair service offers an initial inspection free of charge, with repairs starting from RM200. The actual quote depends on the cause and scope after inspection; this is not a fixed price for all optimisation work. Send the URL and symptoms for an initial review before deciding.
Frequently asked questions about slow websites
Not necessarily. Images, scripts, plugins, database work, user connections and server response can all contribute. Check the evidence before changing hosting.
No. Prioritise the user experience and working functions. Lab scores help diagnosis but do not replace field data or tests of forms and checkout.
Not necessarily. Overlapping settings can cause conflicts. Choose a suitable configuration and make sure cart, checkout and private content are handled correctly.
Devices, connections, image sizes and JavaScript work can differ. Compare pages across devices and networks before deciding on a cause.
alfatihstudio offers an initial inspection free of charge, with repairs starting from RM200. The actual cost depends on the cause and scope after inspection; there is no single fixed price for all optimisation work.
Not necessarily. Check dimensions and export quality too. If suitable images are already in place but the page remains slow, investigate main-image loading, scripts, caching and server response.